 Skip to main content


Many rental companies know their total revenue, but far fewer have a clear picture of which products are actually driving profitability. Which items have high rental rates, which tie up capital without providing enough return, and where should you invest further?
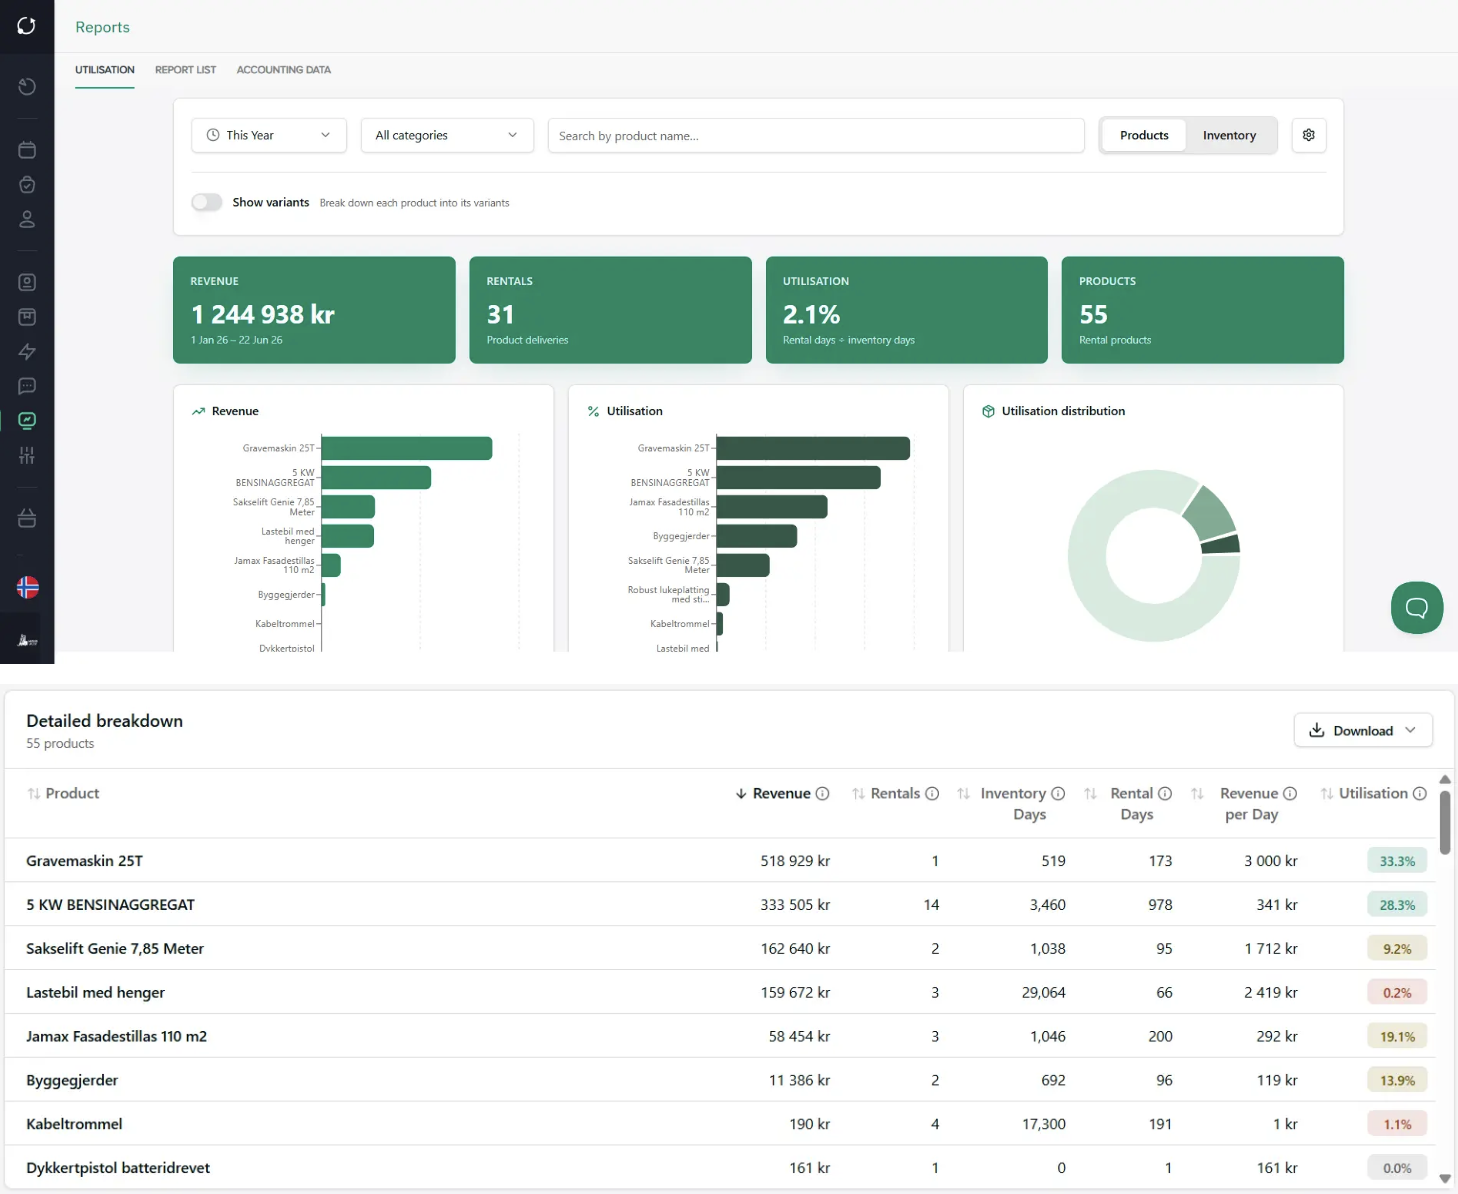
It’s difficult to make good decisions about purchasing, pricing, and capacity when those decisions are based more on experience than on data. With the Utilization Report in Sharefox, you get key metrics for rental rates, utilization rates, revenue, and rental days per product, variant, and inventory unit. This provides a better foundation for understanding what creates value in your product range and where it makes the most sense to prioritize your efforts going forward.
What does a report on occupancy rates and profitability show?
A report on utilization rates and profitability shows how well your rental fleet is actually being used, and which products generate the most value during the selected period.
In Sharefox, the Utilization Report combines several key metrics in a single view, allowing you to analyze activity, availability, and financial value per product:
- Revenue
- Number of landlords
- Days available for rental
- Days the product was actually rented
- Utilization rate
- Average revenue per rental day
This makes it easier to see which products are used frequently, which ones generate the highest sales, and which parts of the product line have the greatest potential for improvement.
See the utilisation report in action
This short walkthrough shows how the report works in Sharefox, the key metrics you can track, and how to use it to analyze inventory utilisation, revenue, and the profitability of your rental fleet.
Why is the occupancy rate important for a rental company?
For many rental companies, their equipment fleet is the company’s largest investment. When capital is tied up in machinery, tools, vehicles, sports equipment, storage units, or other rental products, it becomes crucial to know how effectively these assets are actually working for you.
Two products may cost about the same to purchase, but deliver completely different value in operation. One product may be rented out almost continuously and generate high revenue throughout the season. Another may sit idle for much of the year without contributing significantly to revenue.
When you view occupancy rates, utilization rates, leasing activity, and revenue in the same report, it becomes easier to:
- Prioritize the right purchases
- Adjust prices based on actual demand
- Identify products that should be phased out, relocated, or marketed more effectively
- Plan capacity ahead of the peak season
- Document investment decisions with specific figures
In short: You’ll have a better foundation for increasing profitability without adding complexity.
From gut feelings to better procurement planning
One of the most important benefits of a report like this is that it makes it easier to plan purchases based on actual rental history, not just assumptions.
Many rental companies are well aware of which products “feel popular.” But when deciding whether to purchase more units, adjust the product mix, or invest in a new category, relying on gut instinct alone is often not enough.
The Utilization Report provides you with a more accurate basis for decision-making. Among other things, you can see:
- Which products are rented out frequently over time
- Which products generate high revenue per rental day
- Which variants are actually used the most
- Which items have low activity despite high capital tied up
This makes it easier to allocate capital where it actually yields the best return.
Examples: How the report can be used in practice
Here are three typical situations in which a report on occupancy rates and profitability can lead to better decisions in a rental business.
1. Understand seasonal patterns and plan capacity more effectively
Let’s say you run a machinery or tool rental business and notice that product group A has a very high rental rate during the summer months.
When you see this in the report, you can ask better questions:
- Is this a recurring seasonal trend that means we should stock up on more units before summer?
- Should we adjust our prices during periods of high demand?
- Do we have sufficient inventory across all locations when demand peaks?
Instead of simply noting that “June was a busy month,” you’ll have a data set that can be used to better plan your purchasing, capacity, and campaigns for next season.
2. See the impact of new variants in the product line
Another example is when you’ve expanded a product group to include more variants.
Perhaps you’ve added new sizes, models, or complementary products to product group B, and the report shows that sales have multiplied since the product range was expanded. At the same time, you notice that these products are often rented by the same customers over time, which may indicate that the expansion also leads to greater customer loyalty and higher repeat purchases.
This may indicate that:
- More variants make it easier for customers to find the right product
- The product range meets more needs within the same customer segment
- There is clear potential for further investment in this category
This type of insight is valuable because it links product assortment decisions more closely to actual trends in demand and sales.
3. Identify products that tie up capital without delivering sufficient value
Many rental companies have products that “have always been there,” but that do not necessarily contribute enough to profitability.
The report can make it easier to identify products that:
- Has a low occupancy rate over time
- Has few renters compared to similar products
- Generates low revenue per rental day
- Takes up space and ties up capital without providing the desired return
This makes it easier to assess whether the product should be priced differently, moved to a different location, marketed more actively, or phased out in the next investment round.
What sets this report apart from simpler forms of reporting?
Many systems can show how many orders you’ve had or your total revenue. That’s useful, but it’s often not enough when managing a rental business.
What makes the Utilization Report more valuable is that it links revenue, activity, and available capacity.
You don’t just see that a product was rented out 18 times in the course of a month. You also see:
- How many days it was actually out on rental
- What percentage of its available time was used
- How much revenue it generated
- How it performs compared to other products or variants
This provides a more operational and business-relevant understanding of what’s actually happening in the product lineup.
Filter, compare, and export data
In Sharefox, the Utilization Report can be used flexibly as a work tool, not just as a static report.
You can filter and analyze data based on:
- Time period
- Product category
- Product name
- View by product, inventory unit, or variant
This makes it easier to answer specific questions along the way, such as:
- How did our winter equipment perform in the first quarter?
- Which products had the highest rental rate over the last 30 days?
- Which products should we review before the next round of purchases?
The report can also be exported to CSV and Excel, so you can continue working with the data internally if you wish.
A better basis for decision-making to support further growth
When you gain a better overview of which products are actually performing well, it becomes easier to make sound decisions regarding both day-to-day operations and future investments.
You can use the report to:
- See which products are worth purchasing more of
- Identify underperforming products
- Assess whether pricing is appropriate
- Prioritize which product groups should be further developed
- Plan more effectively ahead of peak season
For rental companies looking to grow profitably, this is valuable insight—not just as historical data, but as a practical management tool for future growth.
Would you like to see how the report works in practice?
If you’d like to see how the Utilization Report can be used in your rental business, we can show you how the report works in Sharefox and how you can use it to make better decisions about your product lineup, capacity, and growth.
Book a demo with Sharefox to see how you can gain a better overview of which products are actually creating value in your rental business.


Comments 0
Moderated · be civil · comment policy